I Built an AI Finance Chief of Staff for a CPA Firm. Here's What It Actually Does.
Not a chatbot, not a dashboard. A walkthrough of the four things an AI Finance Chief of Staff does on a CPA firm's real numbers: explain what changed, spot the risk the dashboard hides, model a covenant decision, and prep the board questions. Every figure traces to a query. Every output waits for the CFO to approve it.
Not a Chatbot. A Chief of Staff.
I built an AI Finance Chief of Staff for a mid-market CPA firm and put it on the firm's real numbers — the general ledger, headcount by service line, the AR aging file, the client book. Not a toy dataset. The actual mess a controller works in every month.
Here's the distinction that matters. A dashboard tells you what happened. Revenue is here, margin is there, DSO is this. It's a rear-view mirror with nice fonts.
A chief of staff tells you what changed, why it matters, and what's coming — and then waits for you to decide. That's a different job. It's the job a sharp finance hire does in their first hour of the morning: read the numbers, find the one that's lying to you, and walk into the CFO's office with the question already framed.
Two rules make this trustworthy enough for a finance team to actually use:
- Every figure traces to a query. The model never does arithmetic in its head. It writes a query against the firm's data, the database computes the number, and the assistant narrates the result. Ask it the same question twice and you get the same answer — because the database counted, not the language model.
- Every output waits for approval. It doesn't send anything. It doesn't change the model. It doesn't touch the system of record. It prepares the work to the 85% mark and stops at the seam where a human signs off.
With those two rules in place, here are the four things it does on real data.
1. Explain the Numbers
The pain. A CFO's most common question is one word: why? Why is margin slipping, why is cash tighter than the P&L suggests, why did this line move. Today that question goes to an analyst and comes back two days later as a spreadsheet — or it goes to a dashboard that shows the what and shrugs at the why. The gap between "I have a question" and "I have an answer I trust" is where days disappear.
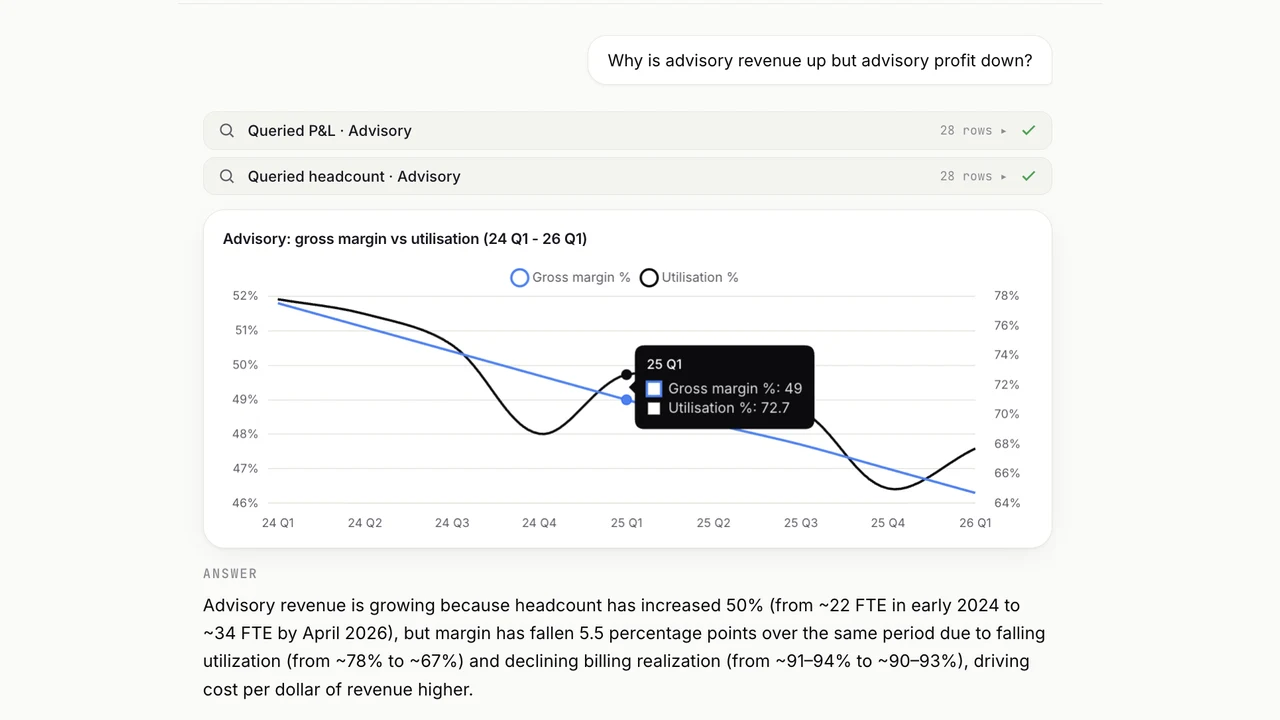
How it solves it. You ask in plain English. The assistant translates the question into a query over the real P&L and headcount tables, pulls the exact rows, and answers with a diagnosis and the numbers underneath it — each one cited back to the data it came from. There's no bespoke "revenue-by-partner" tool buried in code. One governed query engine covers the entire long tail of questions a CFO can think to ask.
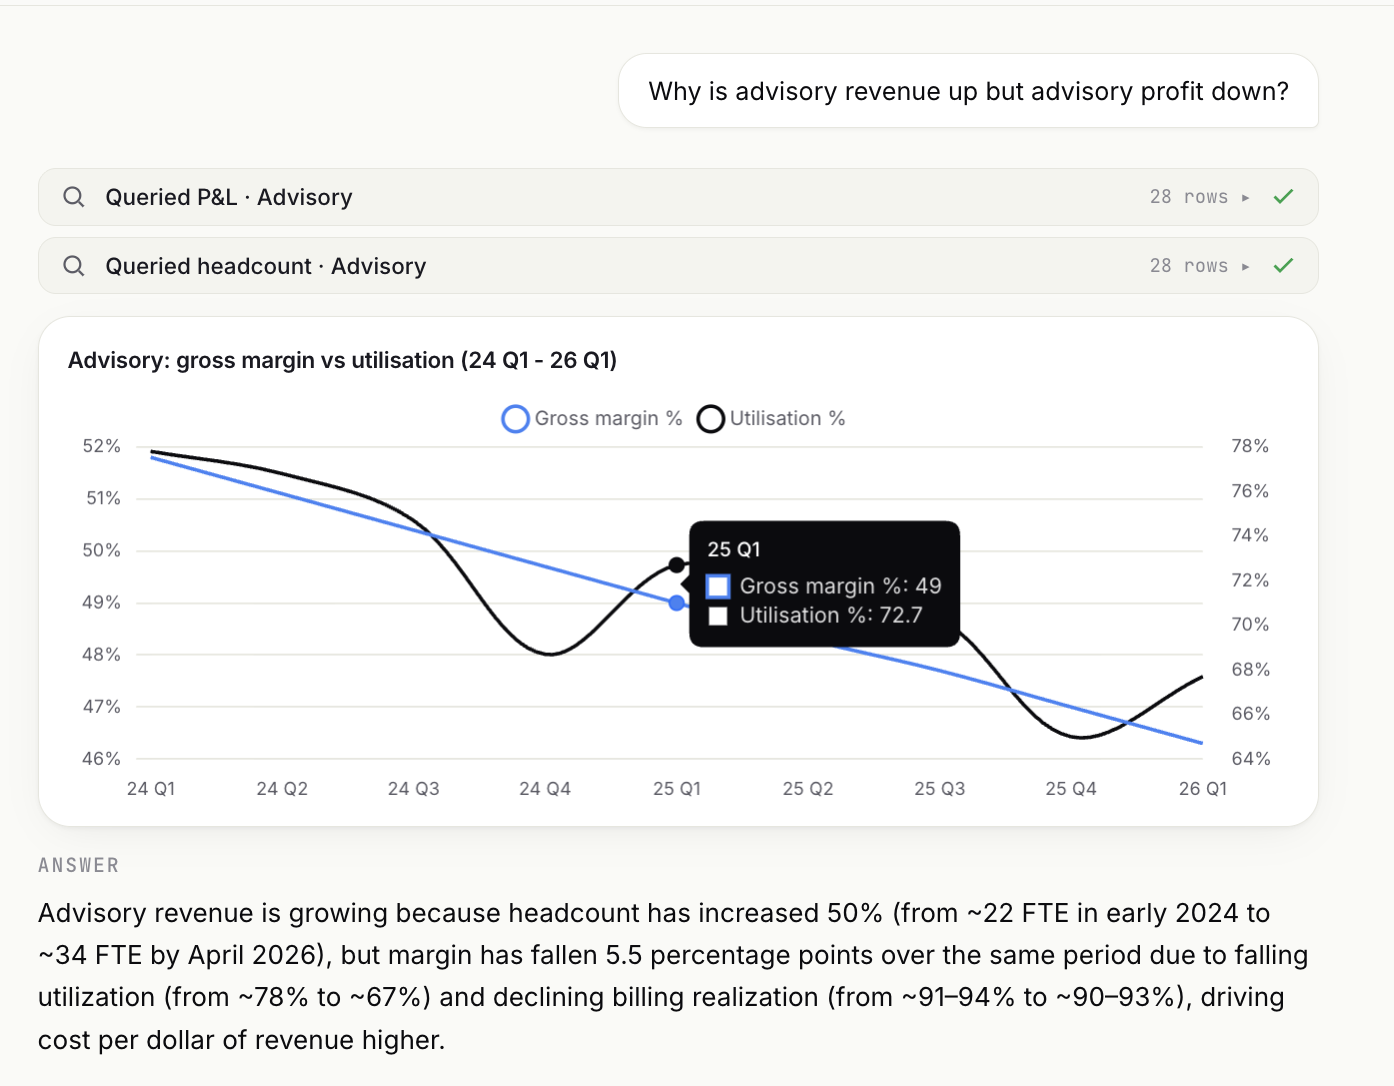
What you're seeing. I asked: "Why is advisory revenue up but advisory profit down?" It queried the P&L and headcount — 28 rows each, checked off — then answered: advisory headcount grew roughly 50% (about 22 FTE in early 2024 to 34 by April 2026), but utilization fell from ~78% to ~67% and billing realization slipped, so cost per dollar of revenue climbed and margin dropped 5.5 points. The chart plots gross margin against utilization so the story is visible in one line. The verdict isn't a number — it's a diagnosis: this isn't a sales problem, it's a capacity problem.
2. Spot the Risk
The pain. The dashboard is green. The firm-level numbers look fine. And underneath them, something is quietly getting worse — a service line stretching its collections, a client concentration that's one lost account away from a hole in the year. The headline average hides it. The CFO finds out when it's already a fire, usually in a partner meeting, usually from someone else.
How it solves it. It runs a proactive scan across the firm's data and ranks what's deteriorating by severity — before anyone asks. Detection and every figure are deterministic, computed by the data layer against threshold rules. The model's only job is to write the read: the "so what" a busy CFO needs in plain English.
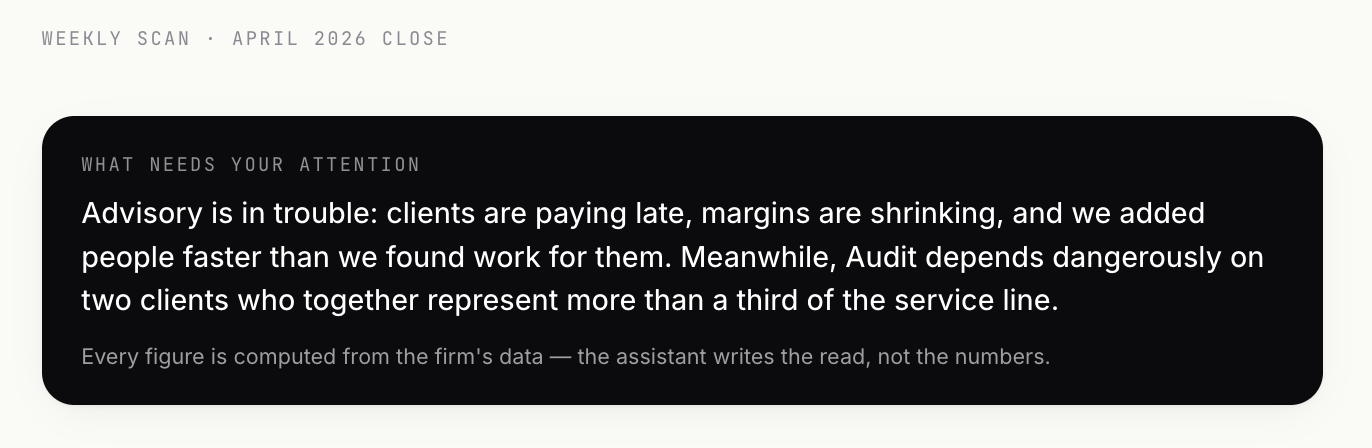
What you're seeing. The weekly scan opens with the read, not a wall of charts: "Advisory is in trouble: clients are paying late, margins are shrinking, and we added people faster than we found work for them. Meanwhile, Audit depends dangerously on two clients who together represent more than a third of the service line." Every figure behind that sentence was computed from the firm's data — the assistant wrote the read, not the numbers.
Then it shows its work. The Audit concentration risk:
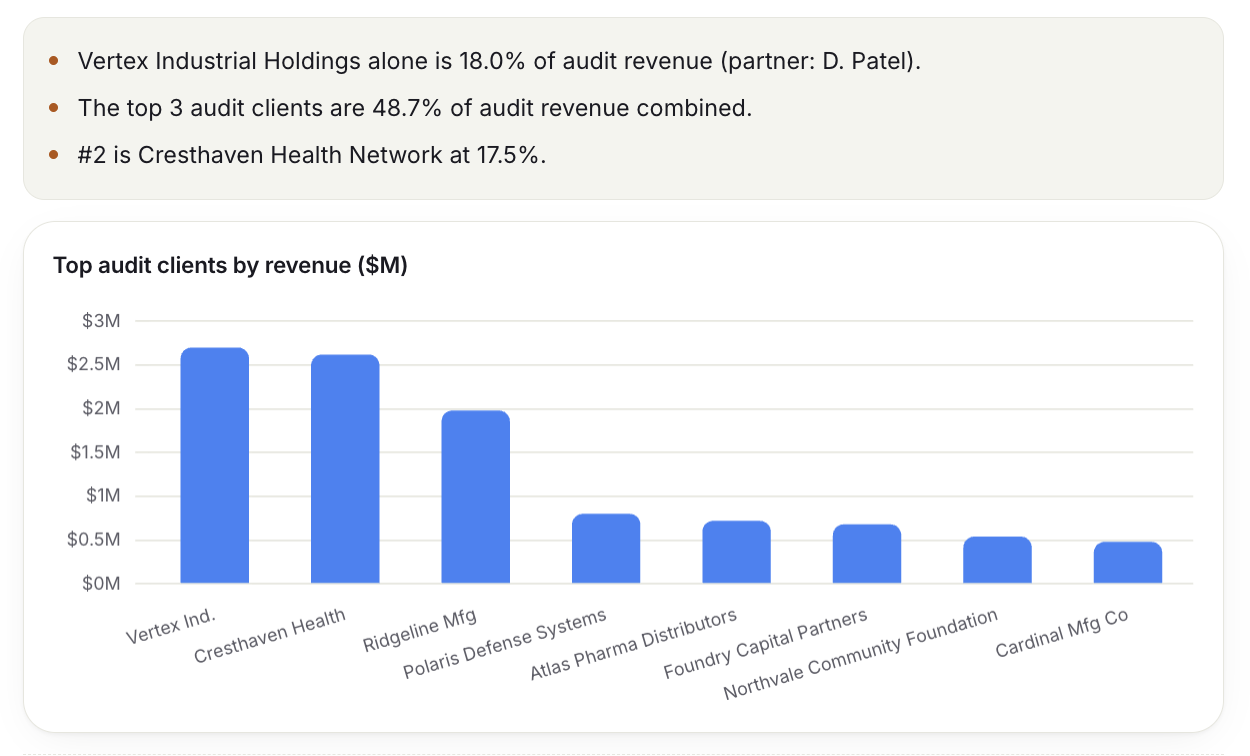
Vertex Industrial Holdings alone is 18.0% of audit revenue. The top three clients are 48.7% combined. Lose one and the service line has a problem the firm-level number would never have warned you about.
And the collections risk the average was hiding:
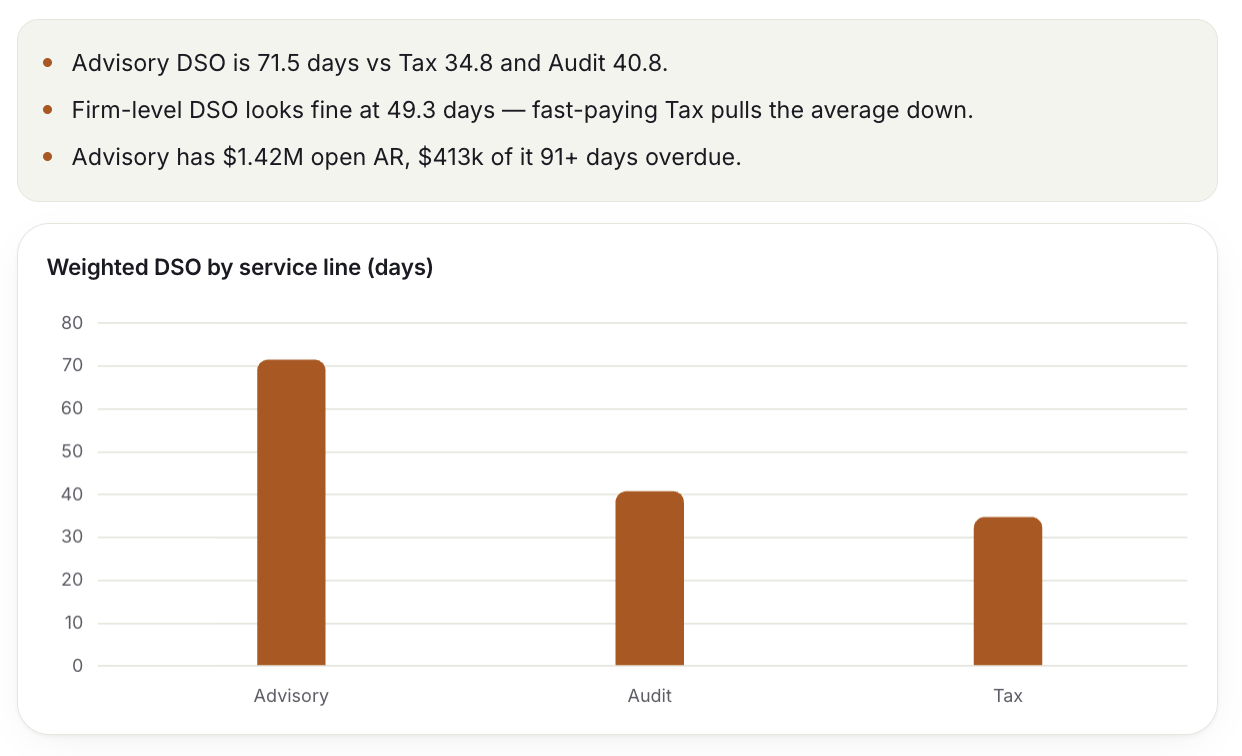
Advisory DSO has stretched to 71.5 days against Tax at 34.8 and Audit at 40.8. Firm-level DSO looks healthy at 49.3 — because fast-paying Tax drags the average down and masks Advisory entirely. Advisory is carrying $1.42M in open AR, $413k of it more than 91 days overdue. That's the cash story the consolidated number was quietly burying.
3. Scenario Forecast
The pain. "Can we open the Chicago office in Q2 without breaching the debt covenant?" is a board-level question that takes days to model — and when it's done, the assumptions live in a spreadsheet only one person understands, in cells nobody else dares touch. The decision is real, the stakes are real, and the analysis is fragile.
How it solves it. It builds three scenarios, projects twelve months forward, runs an explicit covenant check on each, and lets you drag the one assumption that actually decides the outcome — and watch the answer move in real time. The math is deterministic; the model narrates it.
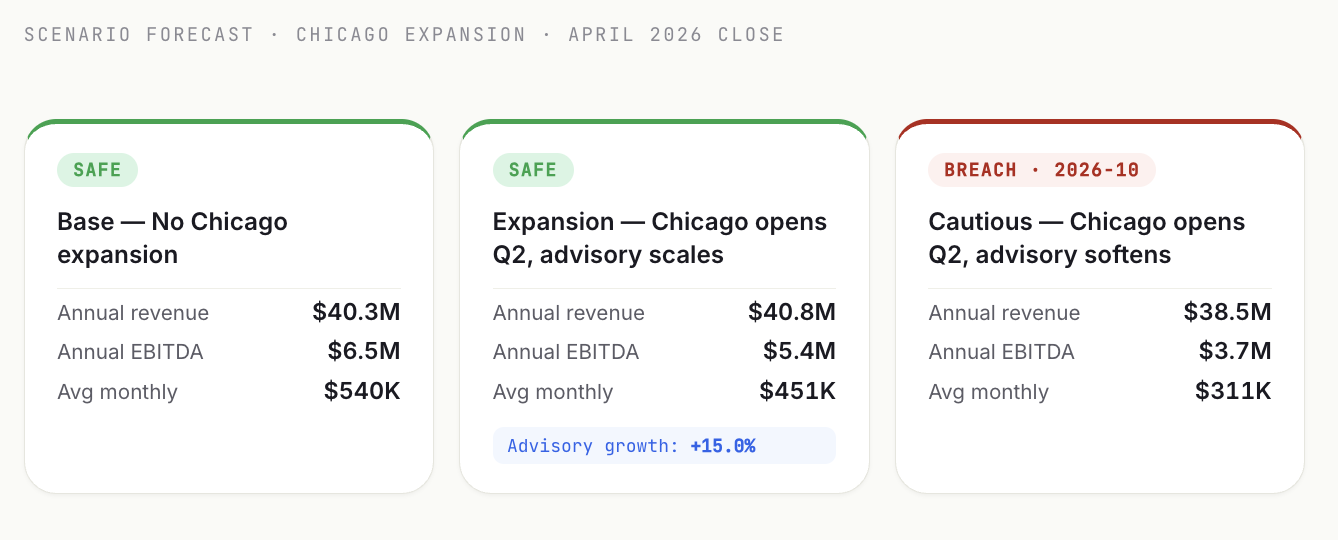
What you're seeing. Three scenarios side by side. Base (no Chicago): safe, $40.3M revenue, $6.5M EBITDA. Expansion (Chicago opens Q2, advisory scales at +15%): safe, $40.8M revenue. Cautious (Chicago opens but advisory softens): flagged BREACH · 2026-10, EBITDA collapsing to $3.7M. Same decision, three futures, and one of them trips the covenant.
Then you can interrogate the assumption that matters:
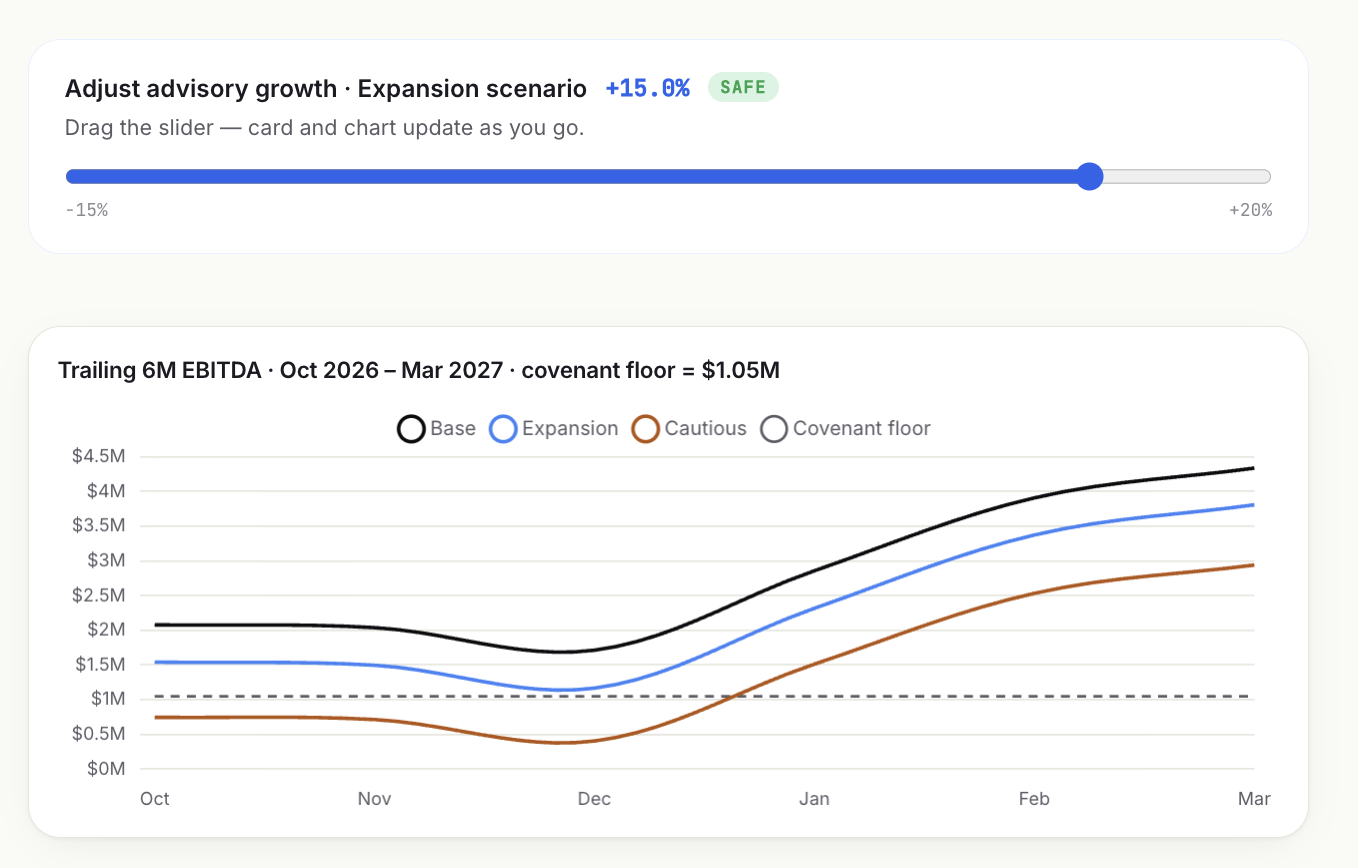
Drag the advisory-growth slider and the trailing-6-month EBITDA line moves against the covenant floor ($1.05M, the dashed line) live. You can see exactly where the Cautious line dips under the floor and exactly how much growth it takes to stay above it. The covenant stops being a number in a loan doc and becomes a line on a chart you can steer toward.
4. Board Question Prep
The pain. The board is going to ask the hard question — the one about the covenant, the one about the assumption you're least sure of. The CFO either walks in having already answered it or gets caught flat-footed in front of the people they answer to. And no CFO alive will let an AI put a number in front of the board that it can't stand behind.
How it solves it. The assistant turns the forecast into a plain-English conditional verdict, names the single lever the whole decision hangs on, and hands the CFO an approval checklist — the exact things to confirm before signing. Nothing advances until the human checks the boxes. This is the seam, made visible.
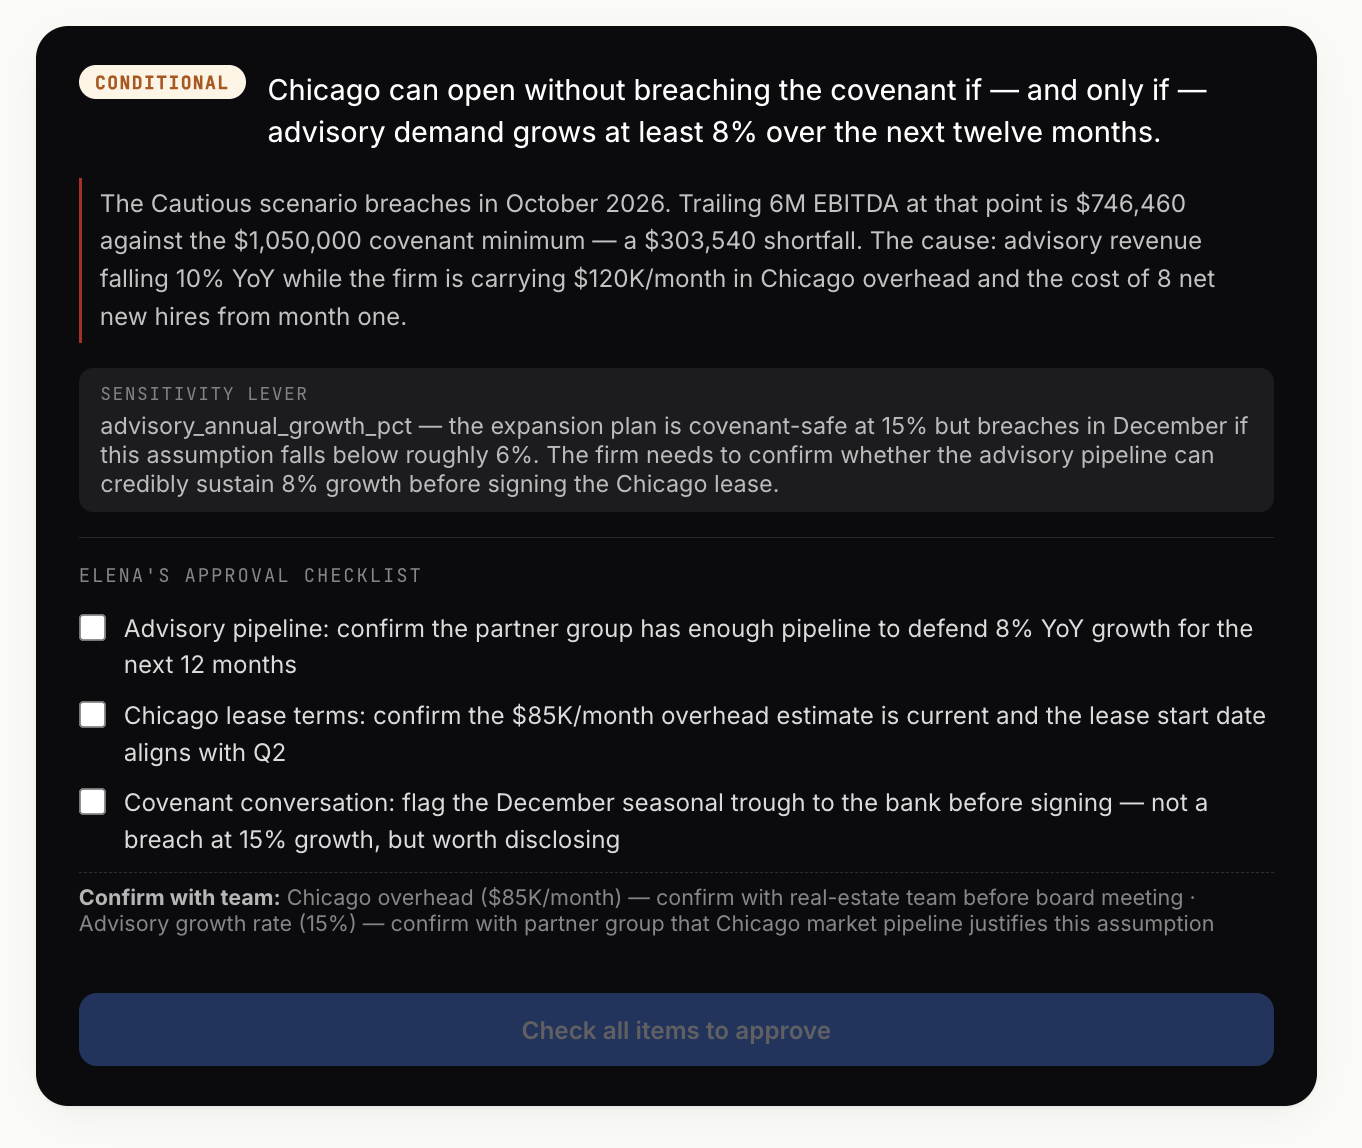
What you're seeing. The verdict is stated as a condition, not a prediction: "Chicago can open without breaching the covenant if — and only if — advisory demand grows at least 8% over the next twelve months." It shows the breach math (trailing-6M EBITDA of $746k against the $1.05M minimum in October 2026 — a $303k shortfall), names the sensitivity lever (advisory growth: safe at 15%, breaches below ~6%), and then stops. It doesn't approve anything. It produces Elena's checklist — confirm the pipeline can defend 8% growth, confirm the lease terms and start date, flag the December covenant trough to the bank before signing — and waits. Check all items to approve. The work is prepared. The human still decides.
What This Adds Up To
Four capabilities, one principle. It explains what changed and why. It surfaces the risk the dashboard was hiding. It models the decision and shows you the covenant line. It prepares the questions the board will ask — before the meeting. And at every step, every number traces back to a query you can check, and every output waits for a human to approve it.
That's the line between data and a chief of staff. A dashboard reports the past. This reads the present, points at what's coming, and hands you the decision with the homework already done.
It doesn't replace the CFO. It removes the ceiling on how much of the CFO's judgment the firm gets to use. The routine analytical work — the pulling, the modeling, the variance hunting — gets done in seconds and consistently. The judgment, the relationships, the call on whether to sign the Chicago lease: still the human's, every time.
What's Next
The four builds above are reactive in the best sense — you ask, it answers; it scans, you read. The next one is always-on: a curated CFO briefing assembled automatically at the start of each week. KPIs against plan, the macro and sector news that actually touches this firm, upcoming reporting and regulatory deadlines, covenant and liquidity flags, and a prioritized list of the decisions that need the CFO's attention — sitting in the inbox Monday morning before the first coffee. Same rules: every figure traced to a query, nothing acted on without sign-off. The chief of staff that doesn't wait to be asked.
One Honest Thing About These Screens
Marwick & Hale isn't a real firm. It's a fictional mid-market CPA practice — invented on purpose, so I could put the actual product on the actual screen and show you real numbers without putting a real client's books on the internet.
But don't read "fictional" as "faked." The dataset behind every screenshot above is a complete, realistic set of CPA-firm financials: a full general ledger, headcount and utilization by service line, the AR aging file down to the invoice, the entire client book — modeled on how a practice this size actually operates. And everything the system did on top of it — the queries, the risk detection, the covenant math, the citations — is the production system, not a scripted walkthrough. Every number you saw was computed live from that data, and every one of them traces back to the query that produced it.
That's the whole point of using a fictional firm: it lets the work be real and public at the same time. The name on the door is invented. Nothing else is.
See It Run on Your Numbers
If you're a CFO or finance leader weighing what AI can actually do in a finance function — past the chatbot demos — I wrote the playbook down.
Get the CFO's AI Implementation Guide. It's the operator's version: how to pick the first workflow, why the source-of-truth layer comes before the automation, where the human-approval seam belongs, and how to make sure the time you save actually shows up on the P&L. No fluff, no vendor pitch — the same thinking that built the system in this walkthrough.
Frequently Asked Questions
Is an AI Finance Chief of Staff just a chatbot for finance?
No. A chatbot answers questions reactively. A chief of staff explains what changed and why, proactively scans for risk the dashboard hides, models decisions against covenants, and prepares board questions — and every output waits for the CFO to approve it.
How do you stop the AI from getting the numbers wrong?
Every figure traces to a query. The model translates the question into a query, the database computes the number, and the assistant narrates the result. The language model never does arithmetic itself, so the same question always returns the same answer.
Does it act on its own?
Never without sign-off. It reads from the source system, drafts to about the 85% mark, and stops at an explicit approval seam. It doesn't send, doesn't change the model, and doesn't write back to the system of record until a human approves.